 01
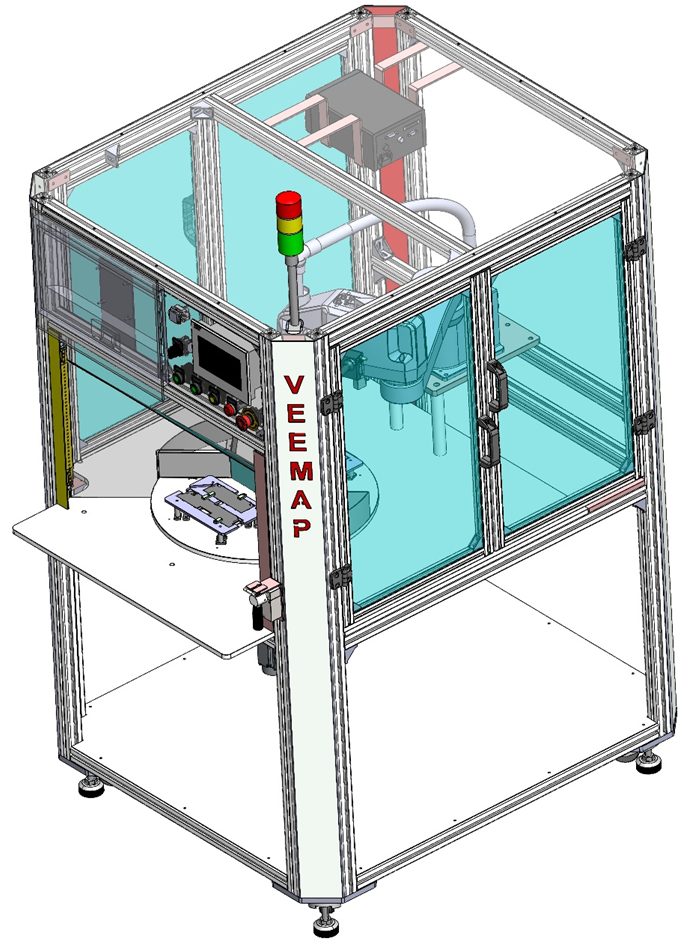
01Semi-automatic platforms
Targeted industrialisation with operator access and controlled process steps. The lowest initial investment that still holds final quality.
One process / one station
Custom machines are specified backwards from the part: what it is made of, how it must be joined, what has to be proven before it moves on, and how many the line has to produce.
The right level of automation is a commercial decision before it is an engineering one. VEEMAP builds at all three scales and will say which one a requirement actually needs.
01Targeted industrialisation with operator access and controlled process steps. The lowest initial investment that still holds final quality.
One process / one station
 02
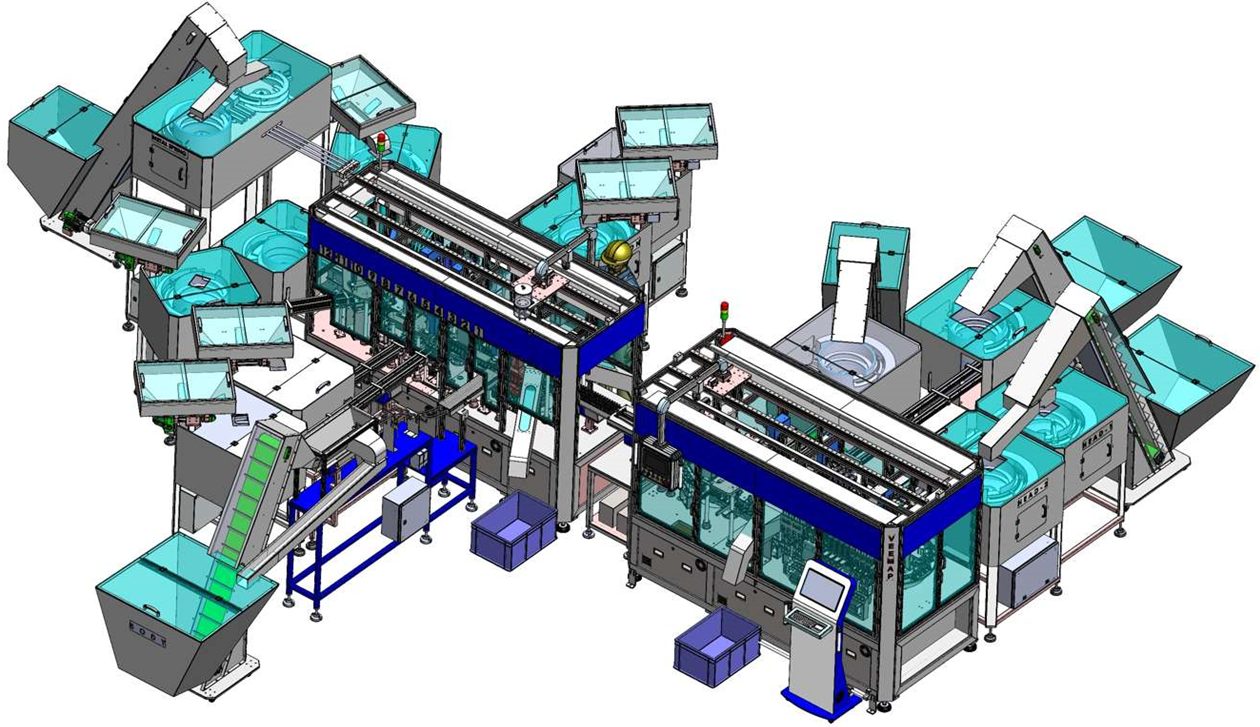
02Indexed or continuous motion, integrating assembly, testing, inspection and material movement into one controlled sequence.
Multiple processes / one line
 03
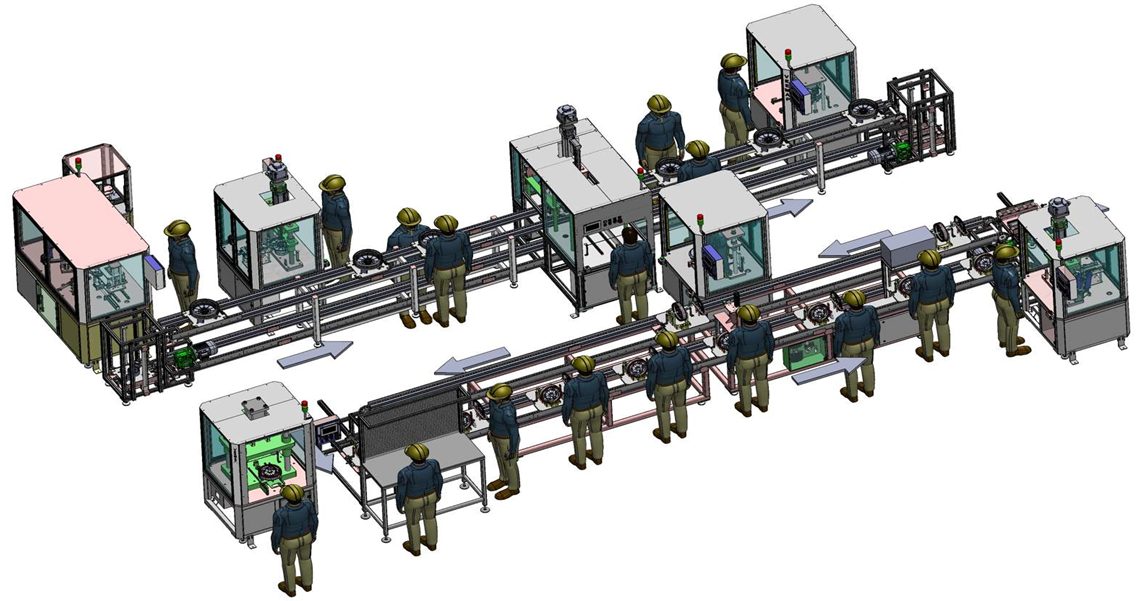
03Machines, conveyors, quality systems, controls and connected data designed together as one manufacturing environment.
Production system / plant scale
A line built for one product at maximum rate will not change over quickly; a line built to run six variants will not match the rate of the dedicated one. Which one wins is a design decision taken early rather than a setting adjusted later.
VEEMAP designs for the point on that curve the requirement actually needs, using indexed or continuous motion, multi-track architectures where the part count demands it, tooling that changes as a set, and parameters held as recipes in the controller rather than set by hand at the machine.
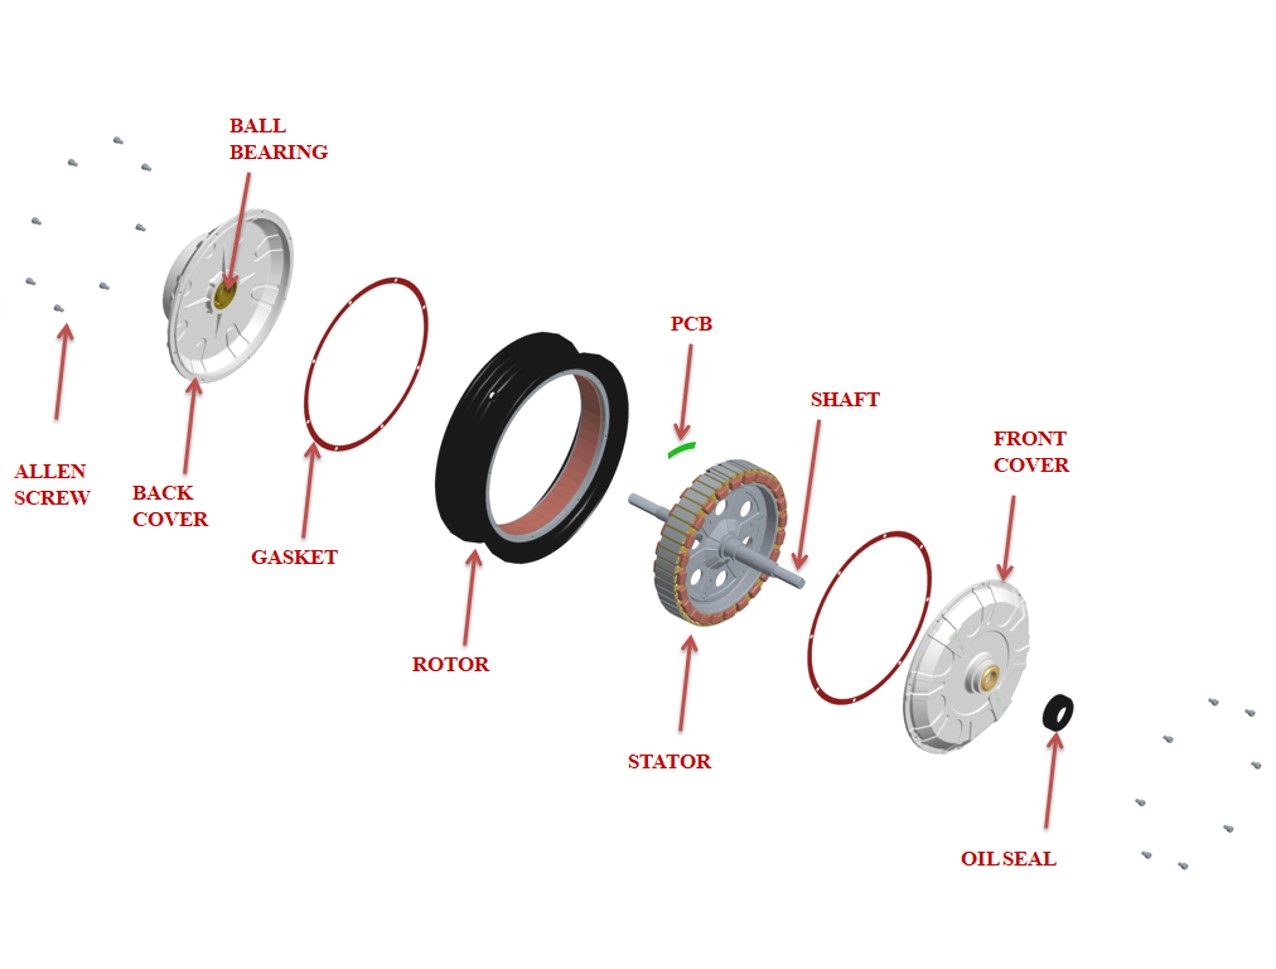
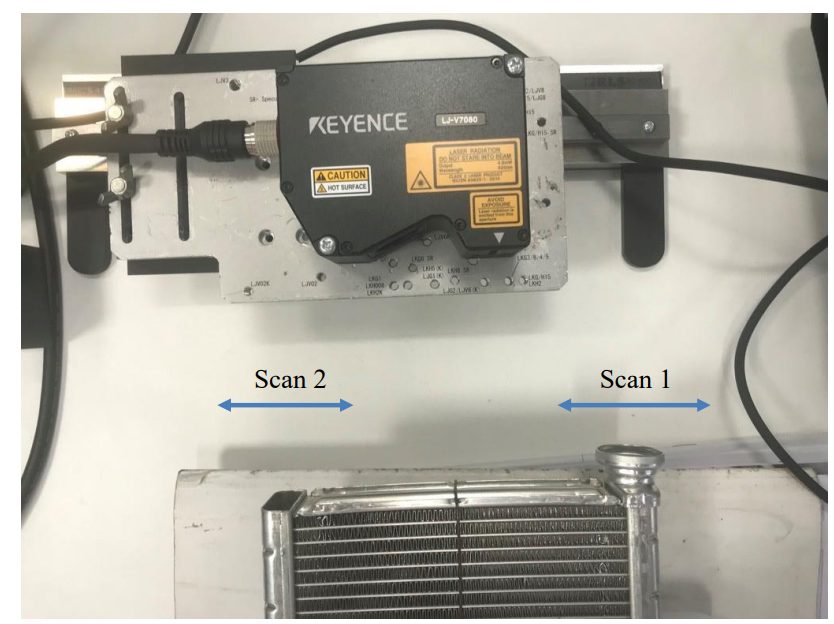
Verification is designed into the sequence rather than added at the end of it: dimensional checking, machine vision, leak and functional testing, controlled reject handling, and traceability tied to the part rather than to the batch.
Production data is integrated where the requirement justifies it, not by default. Machine data is collected locally, retained under the plant’s own firewall policy, and made available to cloud analytics where scale or multi-site reporting calls for it.
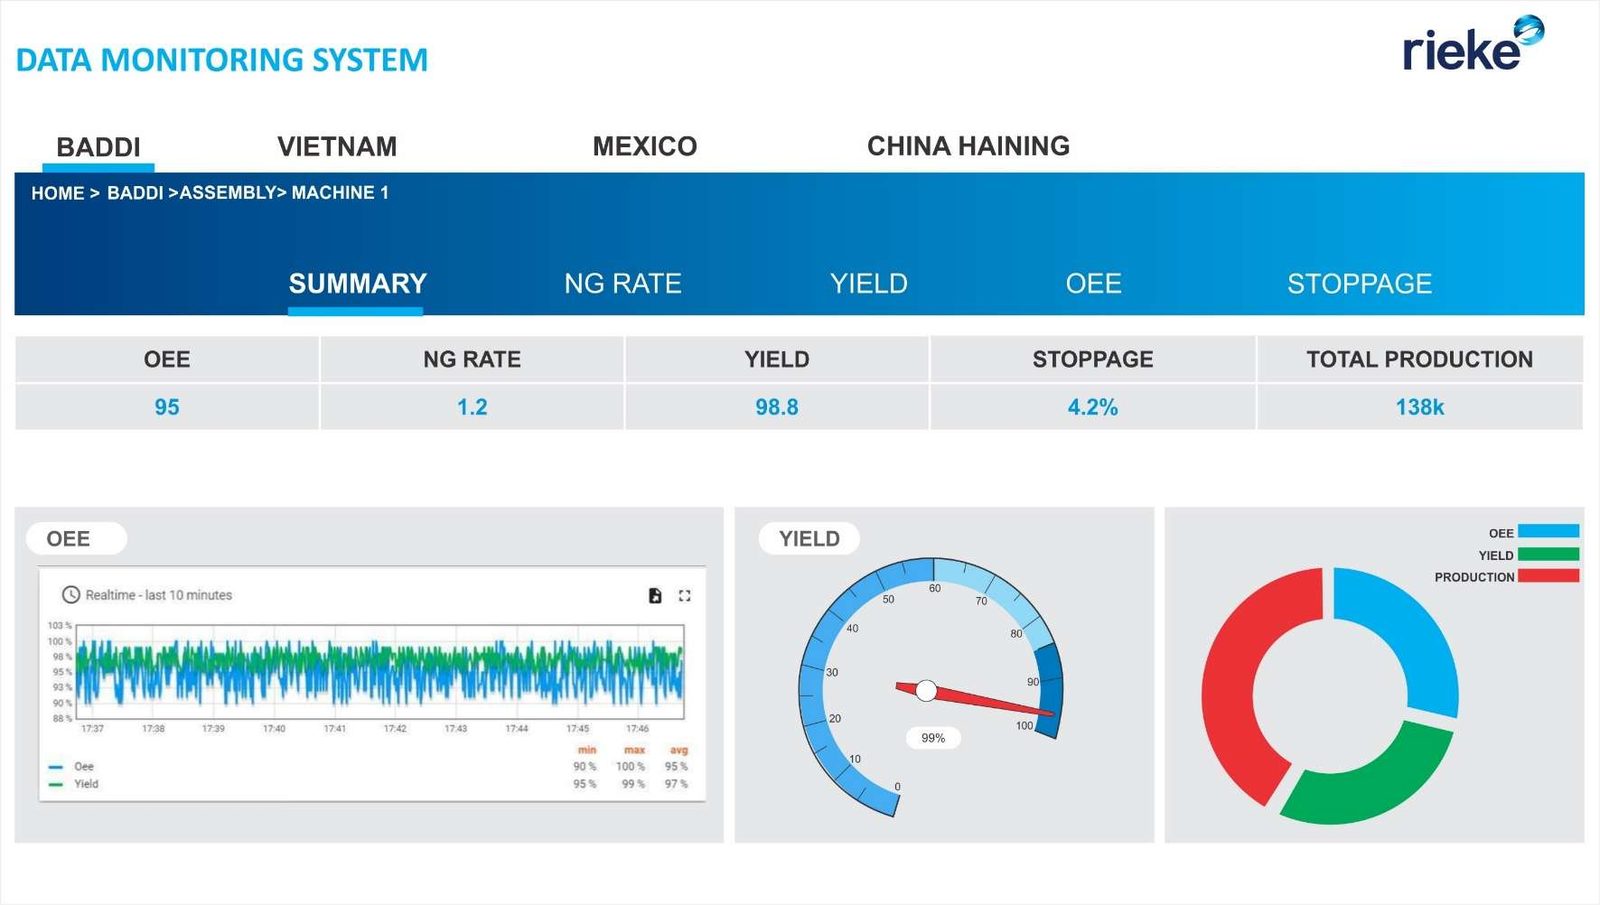
Dashboards are built to the use case rather than to a template: production state, output trend, good and reject counts, inspection results, station health and alarm categories. Operators read them locally at the HMI; engineering and management read the same data through SCADA and dashboard platforms including Zenon and WinCC.
Line state
Running
Good count
18,420
Rejects segregated
212
First-time pass
98.9 %
Station health
Illustrative data. Authored to show what a VEEMAP dashboard reports — not measurements from a delivered system, and not a performance claim.
The most useful first message describes the product, the process step that is constraining you, what has to be verified before a part moves on, how many variants you run, and the production context you are targeting.
Prepare an enquiry